How to Read TRREB Market Statistics and Use Them With Clients

To explain the Toronto housing market to clients, pull three numbers from TRREB's monthly Market Watch report: home sales, new listings, and the MLS HPI benchmark price. Compare each to the same month last year, translate them into plain English, and connect them to your client's specific situation. Everything else in the report adds nuance to those three.
Clients do not expect you to be an economist. They expect a translator. The agents who win listings and keep nervous buyers moving are the ones who can turn a page of board statistics into two or three plain sentences tied to the client's own decision. Here is how to read the report and do exactly that, using the June 2026 edition as a worked example.
What is TRREB Market Watch and when does it come out?
Market Watch is the monthly statistics package published by the Toronto Regional Real Estate Board. It is a free PDF on the TRREB Market Watch page, and it covers home sales reported through TRREB's MLS System across the GTA: Halton, Peel, the City of Toronto, York, Durham, and parts of Dufferin and Simcoe. Each edition lands in the first few business days of the following month; the June 2026 report, for example, was released on July 3, 2026.
Inside you get the headline numbers (sales, listings, prices), a breakdown by major home type, and detailed summary tables for every municipality and Toronto district. Most agents skim the first page and stop. The client-facing gold is in the tables at the back, and we will get there.
The six numbers to check first
TRREB's Market Watch comes down to six core numbers: sales (how many homes changed hands), new listings (how many sellers came to market), active listings (how much inventory is available), the average selling price, the MLS HPI Composite benchmark (the price trend for a typical home), and days on market (how quickly homes are selling). Read each one against the same month last year, not against last month, because real estate is seasonal. Rising sales combined with falling listings means the market is tightening, and prices usually follow with a lag; the reverse means buyers are gaining leverage. In June 2026, GTA sales rose 9.4 per cent year over year while new listings fell 12.9 per cent: a tightening market, even though prices were still below last year's levels.
Here is the June 2026 scorecard, from TRREB Market Watch, as of July 2026:
| Metric | June 2026 | vs June 2025 | What it signals |
|---|---|---|---|
| Home sales | 6,770 | +9.4% | Demand is recovering |
| New listings | 17,282 | -12.9% | Fewer sellers coming to market |
| Active listings | 27,329 | -13.5% | Inventory is shrinking |
| Average selling price | $1,058,658 | -3.9% | Prices still below last year |
| MLS HPI Composite | Benchmark index | -5.4% | A typical home is worth less than a year ago |
| Avg. listing days on market | 29 days | Up from 26 | Homes take about a month to sell |
One more figure worth keeping in your pocket: the first half of 2026 saw 31,149 GTA sales at an average price of $1,037,597, as of July 2026. Half-year numbers smooth out monthly noise, which makes them useful with clients planning six months ahead.
Average price, median price, or MLS HPI: which should you quote?
The average selling price is the number the media quotes, and it is the least reliable of the three. It is simply dollar volume divided by sales, so it moves whenever the mix of homes sold changes. If detached sales surge one month, the average jumps even if no individual home gained a dollar of value.
Look at the spread by home type and you can see why:
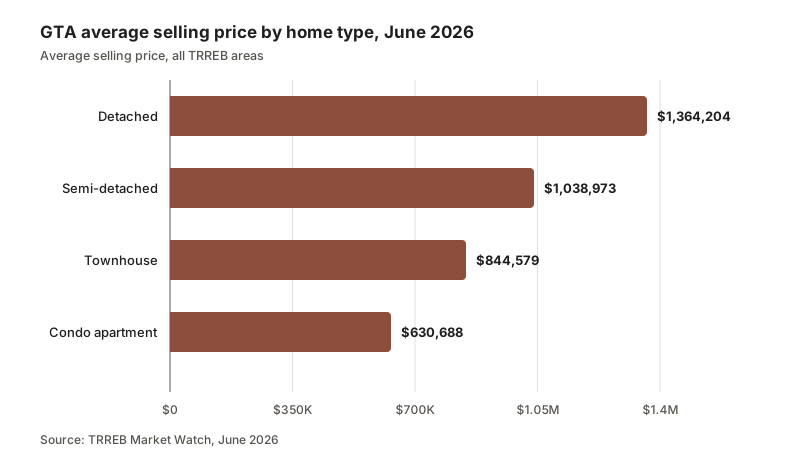
In June 2026 the average GTA detached home sold for $1,364,204 while the average condo apartment sold for $630,688, and detached homes made up about 48 per cent of sales. Shift that share by a few points and the GTA average moves, with no change in what any individual home is worth.
The median price ($890,000 GTA-wide in June 2026) is the middle sale, so a few luxury transactions cannot drag it around. Better, but still mix-sensitive.
The MLS Home Price Index fixes the mix problem. It tracks the price of a benchmark home with consistent attributes over time, so it isolates actual price change. That is why the HPI Composite was down 5.4 per cent year over year in June 2026 while the average was down only 3.9 per cent: a richer mix of homes sold flattered the average.
The practical rule: quote the HPI when the question is "what are prices doing?" and the average or median when the question is "what does a home cost here?" Never switch between measures mid-conversation without saying so.
"While the average selling price was still down year-over-year in June, the annual rate of decline has receded over the past few months." - Jason Mercer, TRREB Chief Information Officer, July 2026
How do you tell if it is a buyer's or seller's market?
Two ratios do most of the work.
The sales-to-new-listings ratio (SNLR) divides sales by new listings. A common industry rule of thumb reads below roughly 40 per cent as favouring buyers, 40 to 60 per cent as balanced, and above 60 per cent as favouring sellers. Market Watch reports this as "SNLR Trend" in its summary tables; the GTA-wide figure was 36.5 per cent in June 2026, as of July 2026. That is technically still buyer's territory, but with sales up and listings down sharply, the ratio is moving toward balance. The direction of travel is the story worth telling clients.
Months of inventory asks a simpler question: if nothing new were listed, how long would it take to sell everything currently on the market? Roughly four to six months is commonly described as balanced. The GTA trend sat at 4.7 months in June 2026.
One more quick check: homes sold for an average of 98 per cent of list price GTA-wide in June 2026. When that ratio crosses above 100 per cent in a neighbourhood, bidding competition is back.
What is the difference between LDOM and PDOM?
Market Watch reports two days-on-market figures, and mixing them up will burn you in a listing presentation.
- Average LDOM (listing days on market) counts days on the current listing only. GTA-wide: 29 days in June 2026.
- Average PDOM (property days on market) counts the full time the property has been for sale, including terminated and relisted attempts. GTA-wide: 42 days in June 2026.
The gap between the two tells you how much relisting is going on. When a seller asks "how long will it take?", quote PDOM. It reflects the real start-to-finish experience of selling, not the optics of a freshly relisted property.
Why you should never quote the GTA average to a local client
The GTA is not one market. In June 2026, the median price in the City of Toronto was $835,000 while Halton Region's was $1,060,000. Durham Region had just 3.4 months of inventory while King, in York Region, had 11.7. Ajax posted a 44.6 per cent SNLR trend; King sat at 20.5 per cent. Same report, same month, completely different client conversations.

Home types diverge just as much. The average condo apartment price was down 9.5 per cent year over year in June 2026, while detached was down only 2.0 per cent. A first-time condo buyer and a detached move-up seller are living in different markets, even on the same street.
So before any client conversation, flip to the summary tables and pull three things for the client's municipality and home type: median price, SNLR trend, and days on market. It takes five minutes and instantly separates you from every agent quoting headlines.
How do you turn the stats into client conversations?
A stat only lands when it is attached to a decision the client is actually making. Three translations that work:
- For the hesitant buyer: "Sales are up 9.4 per cent and new listings are down almost 13 per cent. Prices have not turned yet, but competition is coming back. Waiting for the exact bottom usually means spotting it in the rear-view mirror."
- For the seller anchored to 2025 prices: "The benchmark is down about five per cent from last year, and homes here sell for about 98 per cent of asking in roughly a month. Price to last year and we sit. Price to this market and we sell."
- For the cold lead: "Quick June update for your area: sales up, inventory down, prices flat. If that changes your thinking either way, happy to talk it through."

Then make it a routine. When the report drops early each month, block 30 minutes: read page one, pull your area's summary table, write three plain-English sentences, and send them to your database. That single habit anchors your monthly marketing calendar and gives you a legitimate, non-salesy reason to stay in touch with leads who are not ready to act yet. And if assembling that email is the step that never survives a busy month, a tool like CloseFlow can send automated market-report emails to your contacts on schedule, so the habit runs even when you cannot.
What mistakes should you avoid when sharing market stats?
- Cherry-picking. Quoting only the numbers that support your pitch reads as salesmanship, and clients can check the report themselves in ten seconds.
- Leaving off the date. "Average price is $1.06 million" means nothing without "as of June 2026." Undated stats age badly on social media.
- Treating one month as a trend. A single month can be noise. Look for three months pointing the same way, or lean on year-over-year and half-year comparisons.
- Switching price measures between updates. If you quoted the HPI last month, quote it this month. Alternating between average and benchmark whenever one looks better destroys trust.
- Forecasting with certainty. The data describes what happened. Frame the future as scenarios, not promises.
Market shifts flow through to your own business too: fewer sales and longer days on market change how commissions land through the year, which is worth understanding when you read about what real estate agents actually earn in Ontario.
You do not need to predict the market to be valuable. You need to be the person in your clients' lives who reads the report, strips out the noise, and tells them plainly what it means for their next move. Thirty minutes a month buys you that position.
Frequently asked questions
When does TRREB release its Market Watch report?
In the first few business days of each month, covering the previous month. The June 2026 edition, for example, was released on July 3, 2026. It is a free PDF download on trreb.ca.
What is the difference between the average price and the MLS HPI?
The average price is total dollar volume divided by the number of sales, so it swings with the mix of homes sold. The MLS HPI tracks the value of a benchmark home with consistent attributes, which makes it the better measure of underlying price trends.
What sales-to-new-listings ratio means a balanced market?
A common industry rule of thumb treats roughly 40 to 60 per cent as balanced, below 40 as favouring buyers, and above 60 as favouring sellers. The GTA-wide trend ratio was 36.5 per cent in June 2026, as of July 2026.
Can I use TRREB statistics in my own marketing?
Yes, and you should. Name the source and the month every time, quote figures exactly, and avoid presenting one cherry-picked stat as the whole story. Accuracy expectations in real estate advertising apply to market claims too.
Where do I find stats for my specific area?
The summary tables in each Market Watch report break down sales, median price, days on market, inventory, and the sales-to-new-listings ratio by region, municipality, and City of Toronto district, so you can quote your client's actual market instead of the GTA average.
Sources
- TRREB Market Watch, June 2026 (PDF) (accessed July 2026)
- TRREB news release: Market Gains Traction with Strong Home Sales in June and First Half of the Year (accessed July 2026)
- TRREB Market Watch hub (accessed July 2026)
- TRREB MLS Home Price Index (accessed July 2026)